When it comes to daily step counts, the disparity between Tokyo and Metro Manila goes far beyond the numbers — it reflects the lived realities shaped by urban planning, public safety, cultural habits, and the simple question of whether it’s even safe or practical to walk. One city embraces walkability as a way of life; the other often makes it a daily gamble.
| Group | Average Daily Steps |
| Tokyo (Young Men) | ~8,000 steps |
| Tokyo (Older Women, 65-74) | ~6,308 steps |
| Metro Manila (General Adults) | ~4,000 steps |
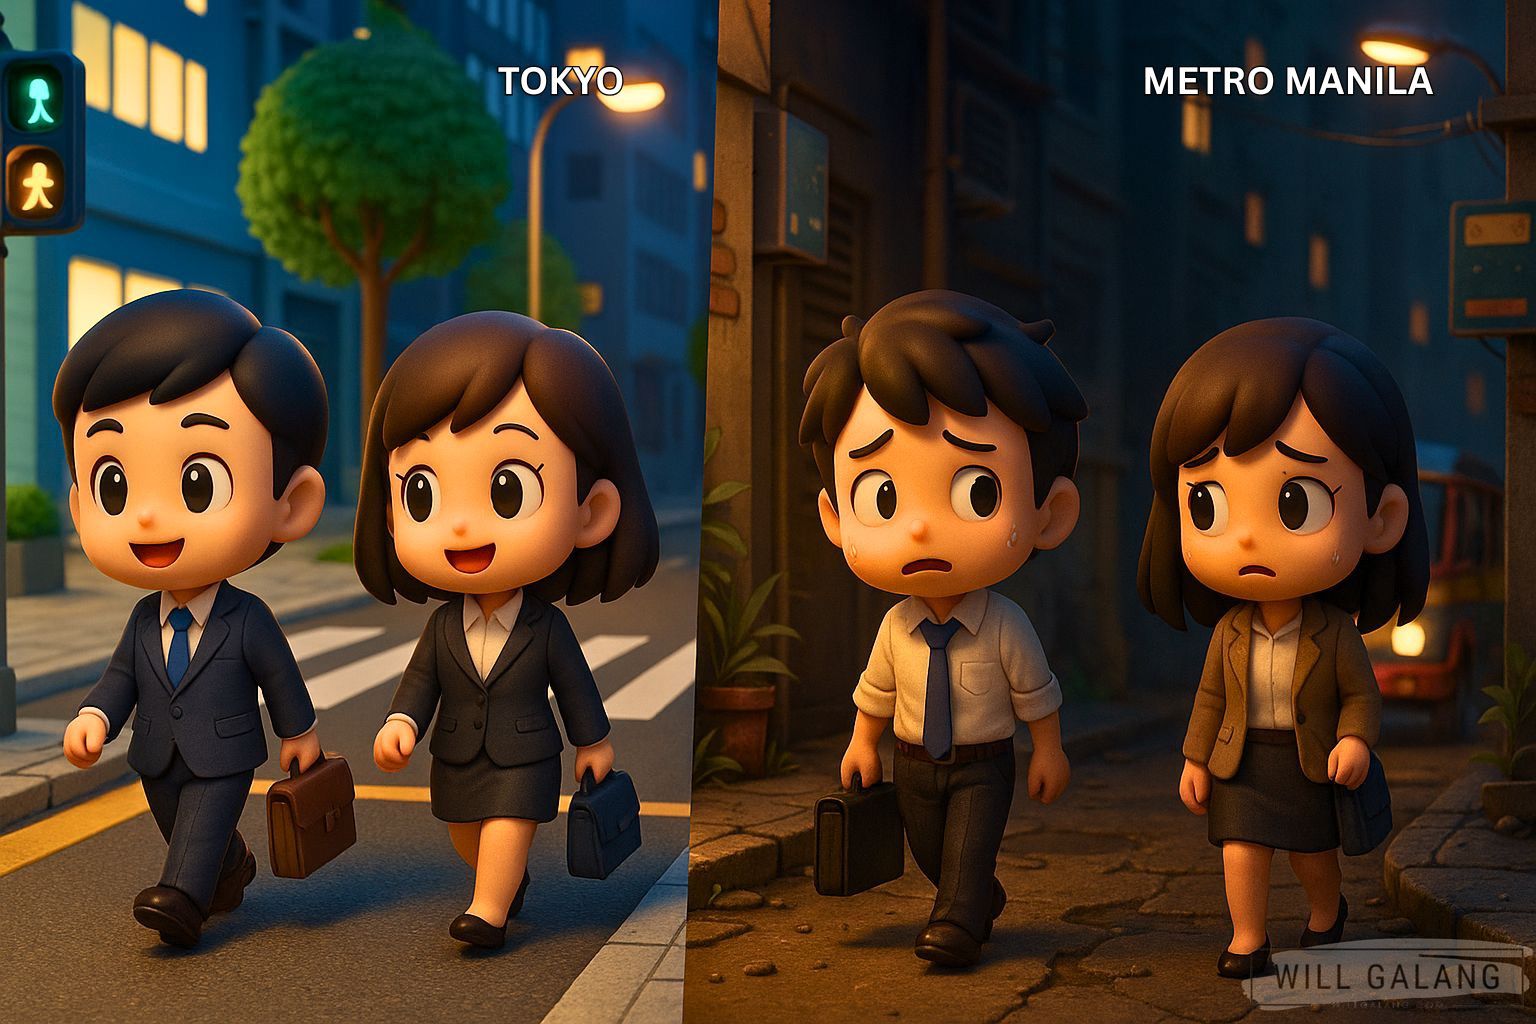
Safety, Culture, and Infrastructure
Tokyo thrives on walkability — not just because people enjoy walking, but because they can. With well-lit streets, pedestrian-friendly design, and low crime rates, walking is safe at nearly any hour.
Meanwhile, in Metro Manila, walking is often a challenge:
- Unsafe or broken sidewalks
- Open manholes
- Fear of crime or harassment
- Urban sprawl demanding motorized transport
Even if someone wants to walk more, the metropolis rarely makes it easy.
Demographics in Motion
- In Tokyo, men tend to walk more than women, and younger adults log more steps than the elderly — though even older Tokyoites average over 6,000 steps.
- In Metro Manila, boys walk more than girls, especially in private schools — but adults show much lower daily step counts overall, barely crossing 4,000.
Final Footnote
The numbers tell a clear story: walking is a privilege shaped by safety, city planning, and lifestyle norms. If Metro Manila wants to catch up, it won’t be enough to encourage walking — the streets themselves need to be made safe, inviting, and walkable first.
Sharing the sources below:
Endnotes
- Althoff, T., et al. (2017). Large-scale physical activity data reveal worldwide activity inequality. Nature. https://www.nature.com/articles/nature23018
- Japan Ministry of Health, Labour and Welfare. (2016). National Health and Nutrition Survey. Summary via Nippon.com: https://www.nippon.com/en/japan-data/h00372
- Osuka, Y., et al. (2021). Physical activity and step counts among older Japanese adults. BMC Public Health. https://bmcpublichealth.biomedcentral.com/articles/10.1186/s12889-018-5434-5
- Arceo, J. & Layug, A. (2017). Pedometer-Measured Step Count in Pre-Adolescent Filipino Students. Philippine Journal of Allied Health Sciences. https://pjahs.ust.edu.ph/wp-content/uploads/2021/10/A4-Pedometer-final.pdf
- Silva, K., et al. (2022). School travel mode and physical activity among Filipino children. International Journal of Environmental Research and Public Health. https://pmc.ncbi.nlm.nih.gov/articles/PMC9579405
- Okada, R., et al. (2018). Impact of population density on step counts in Japanese schoolchildren. BMC Public Health. https://bmcpublichealth.biomedcentral.com/articles/10.1186/s12889-018-6028-y
- Hoadley, J. (2023). Struggling to Get Your 10,000 Steps? Commentary on Japanese walking culture. https://www.linkedin.com/pulse/struggling-get-your-10000-steps-blame-japanese-james-jim-hoadley